3D Reconstruction and Visual Localization in the Campus
Introduction
Term project (independent work) for the course Introduction to Computer Vision (2023 Spring & Summer), Zhejiang University
Supervisor
Prof. Xiaowei Zhou
Project Description
In this project, the aim is to reconstruct a building in our campus using SfM and then complete the visual localization task based on query images (to get a 6 DOF camera pose with the 3D model reconstructed and the query image). I first took a large number of photos of a building on campus during the day and used these photos to reconstruct a 3D sparse model of the building using hloc (a hierarchical localization toolbox). During the reconstruction process, I used several different algorithms for the reconstruction and compared the results. Next, I took many photos of the building at night with low brightness and used these photos for visual localization. I did this first using the localization algorithms already implemented in hloc, and then I trained our own neural network based on pixloc for end-to-end visual localization testing. Ultimately, we compared these two visual localization schemes (mainly measured by the mean reprojection error).
Techique
I complete the whole job mainly with python. I used hloc to reconstruct the 3D model of the building, and implemented the visual localization function with pixloc by training our own model.
Duration
It takes about one month to complete the project (in Dec 2023).
Result
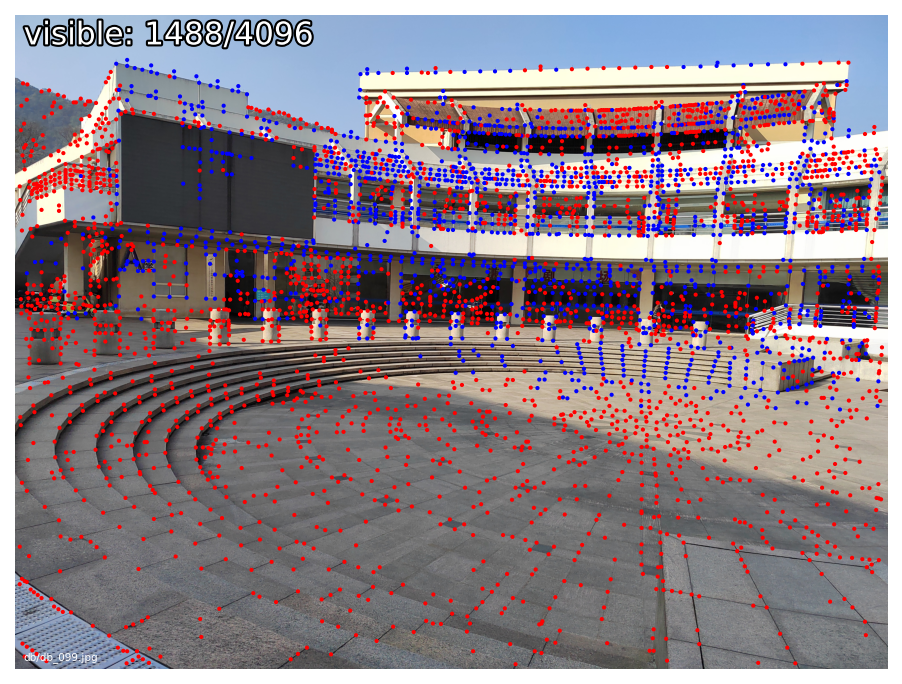
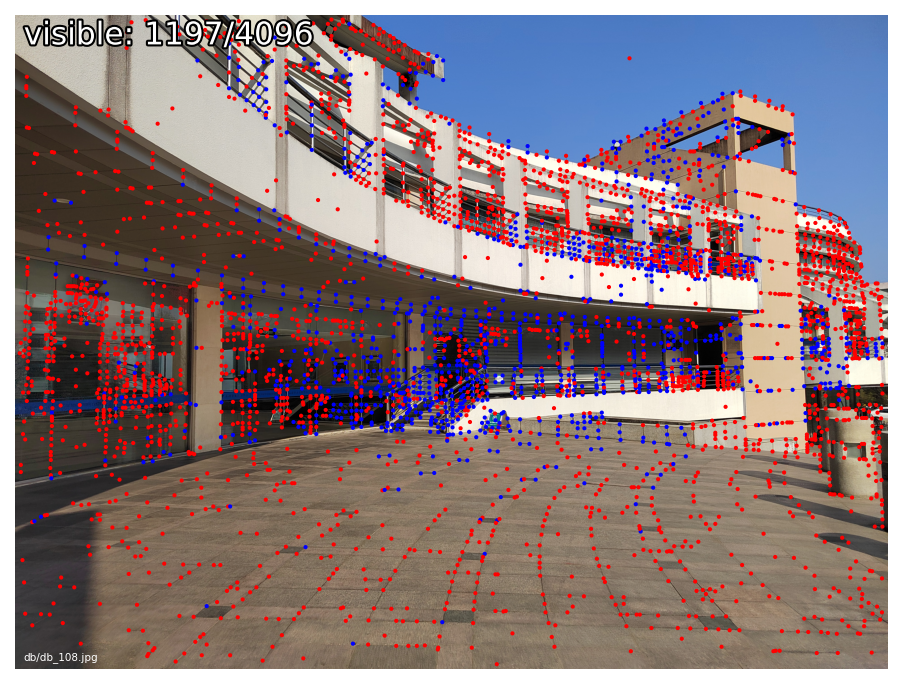
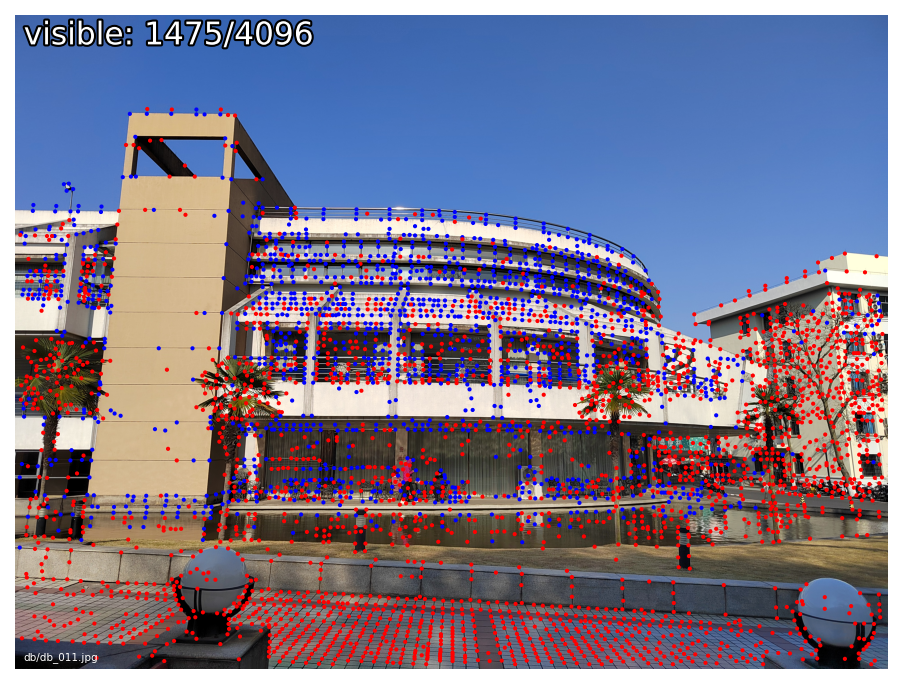
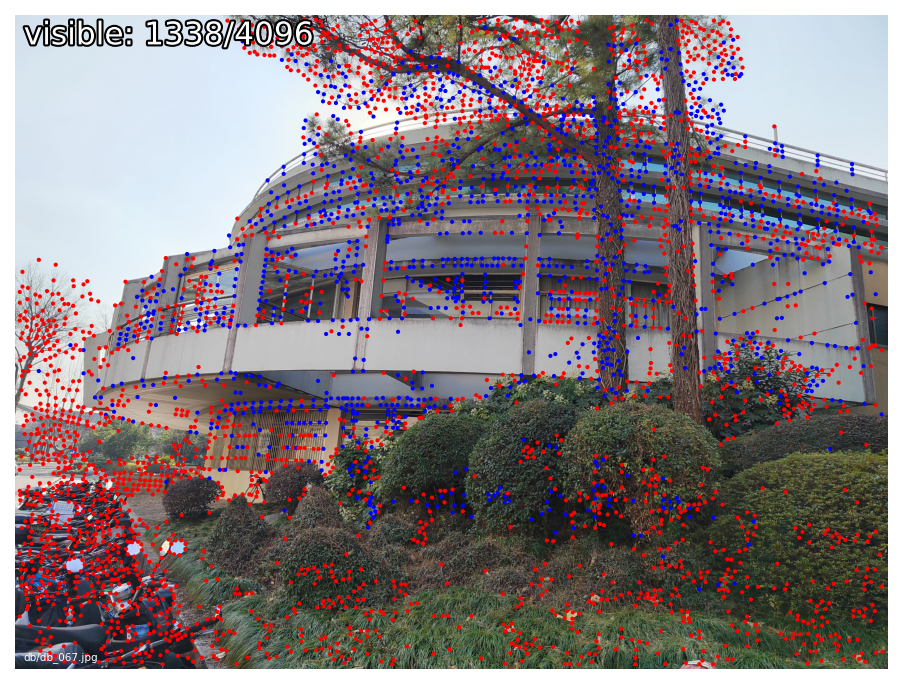
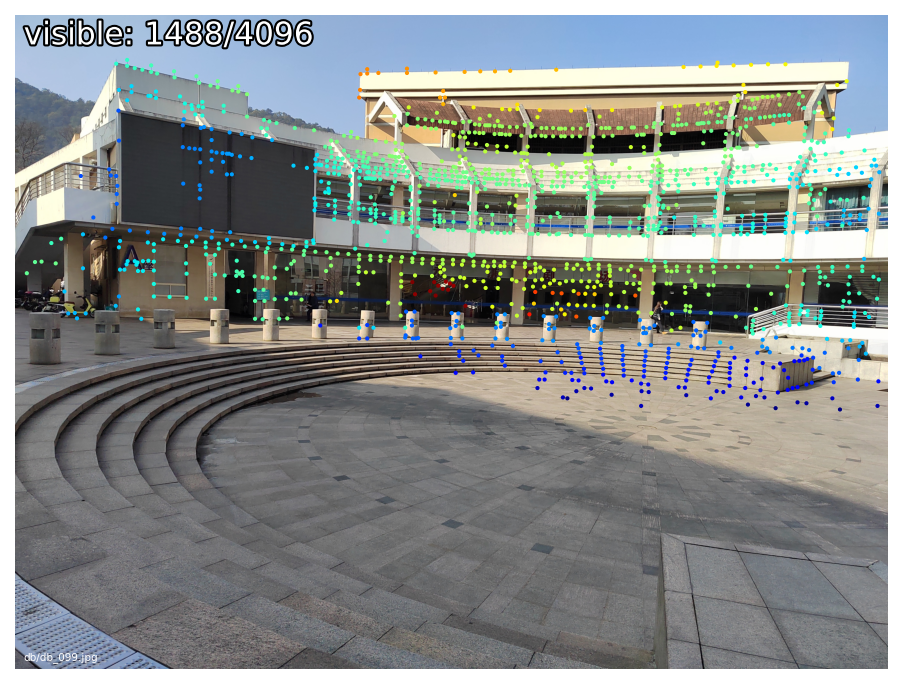
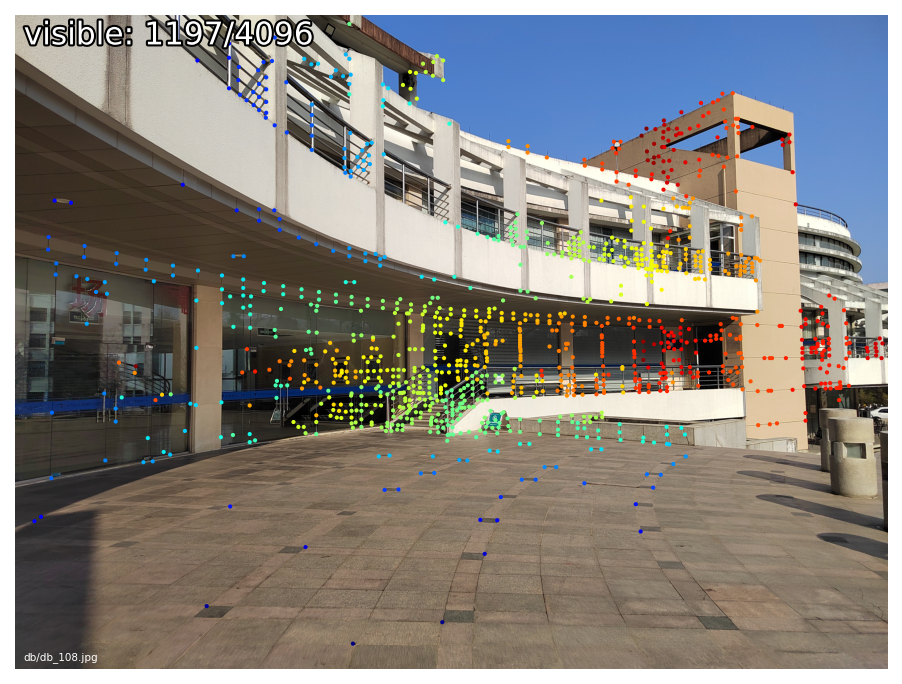
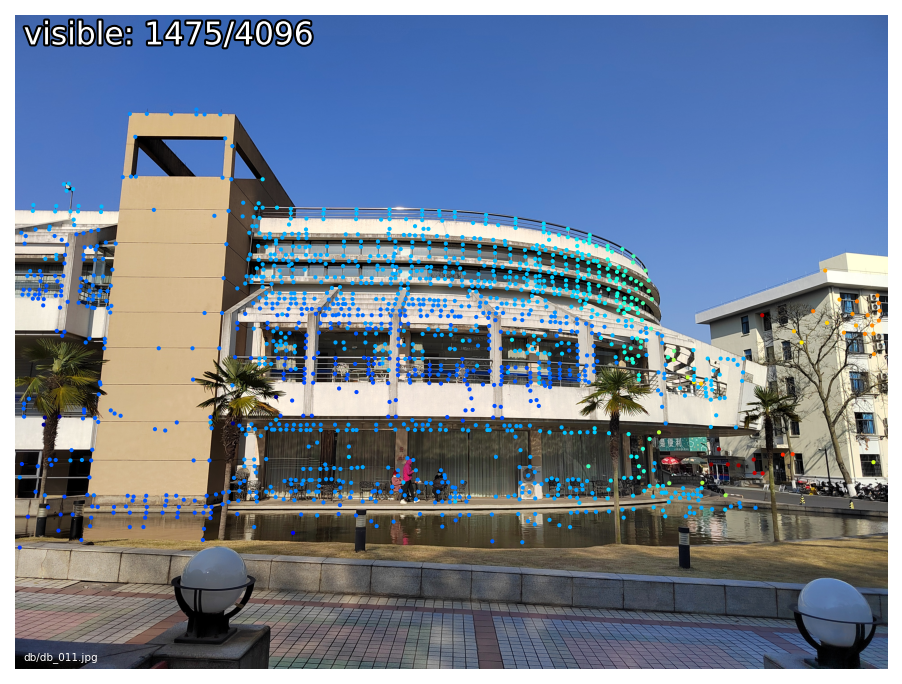
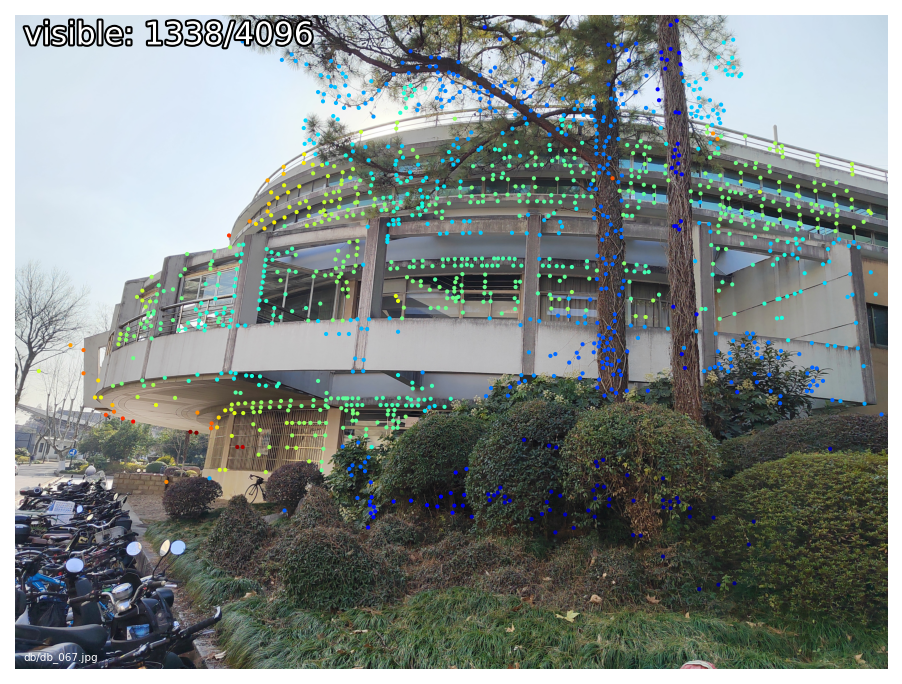
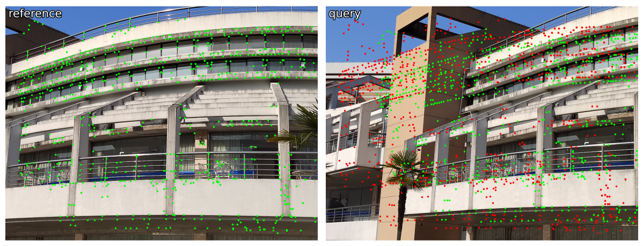
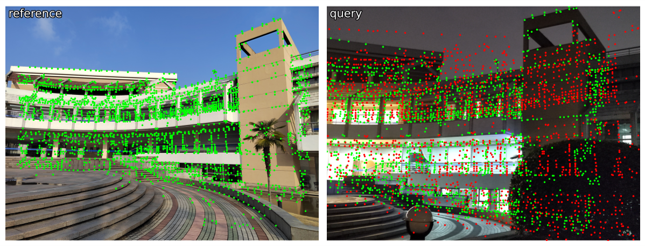
- Here are the visualization results of the keypoints in the database images.
 |
 |
 |
 |
 |
 |
 |
 |
- Here are the reconstructed 3D model and the estimated camera poses.
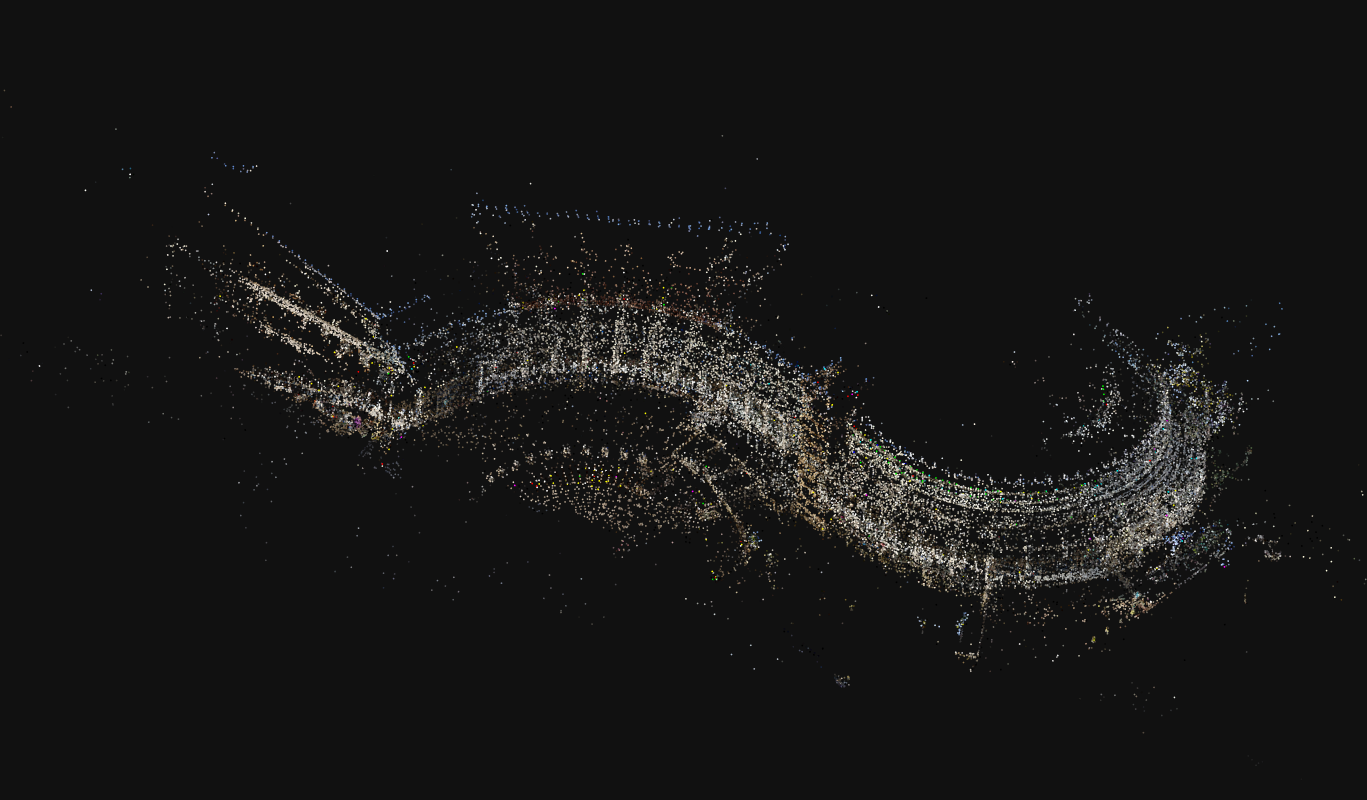 |
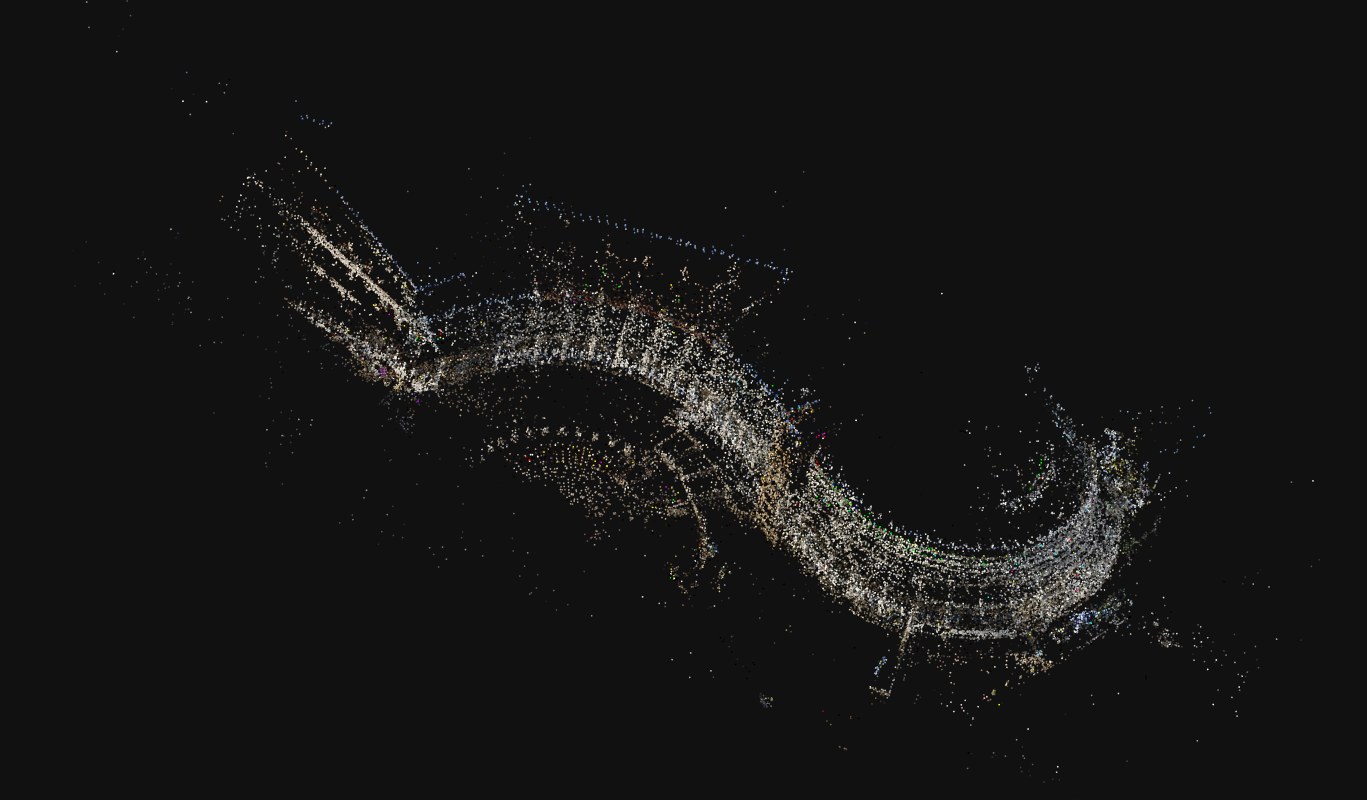 |
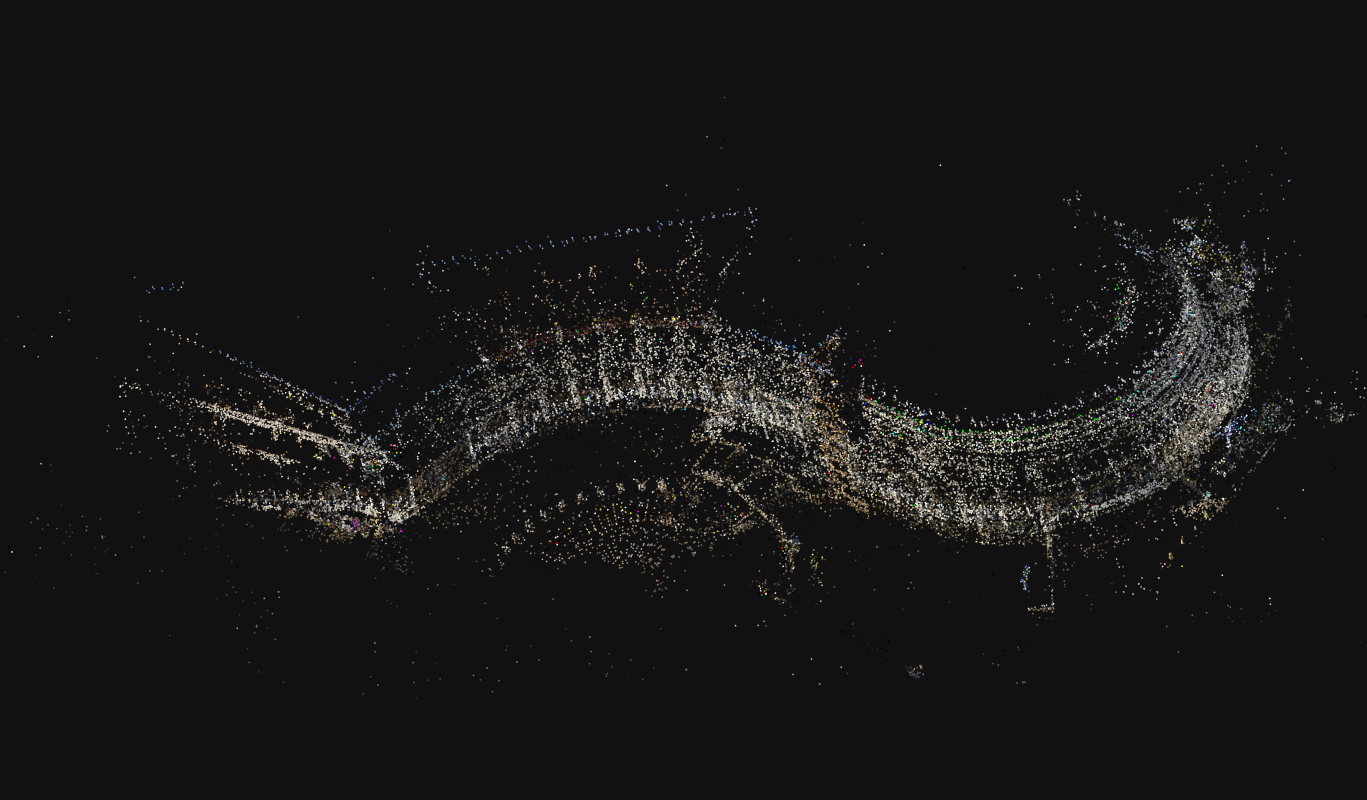 |
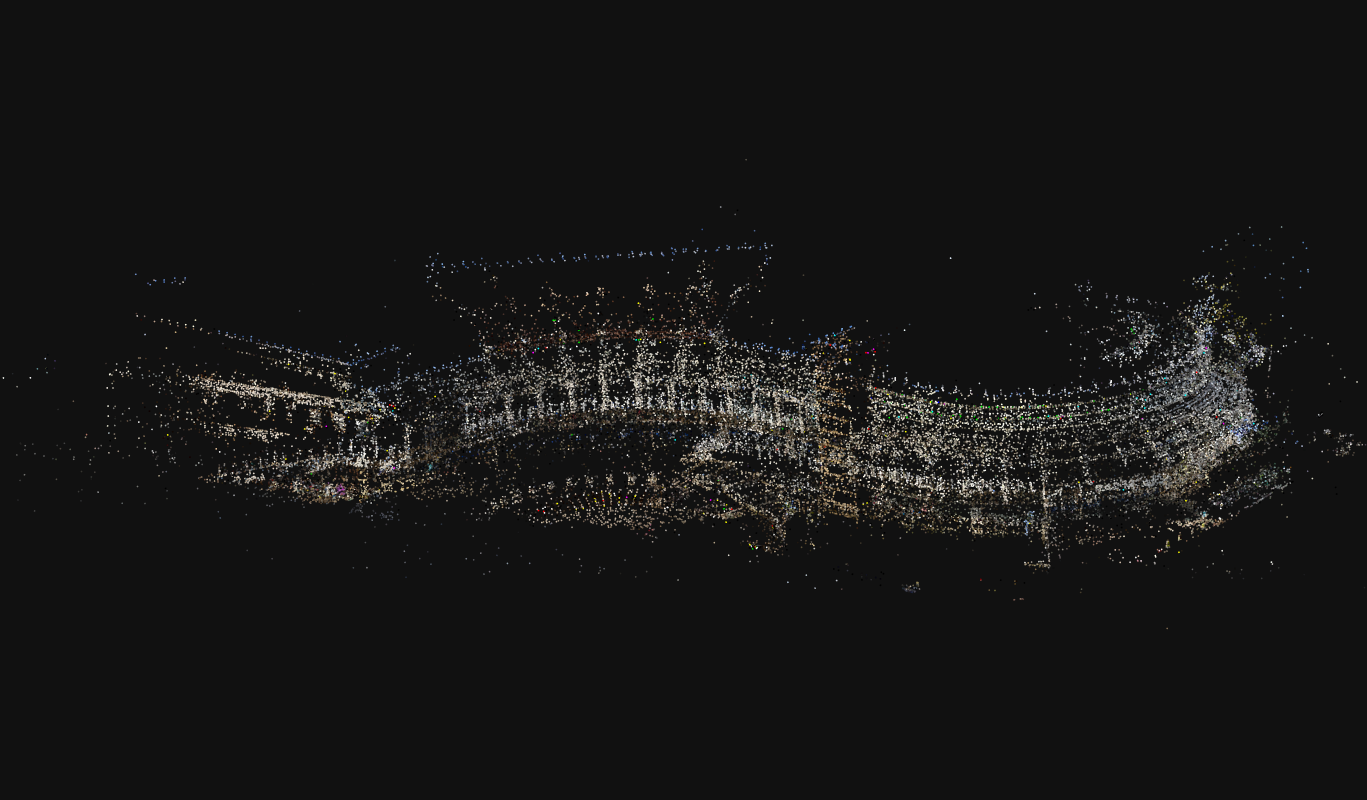 |
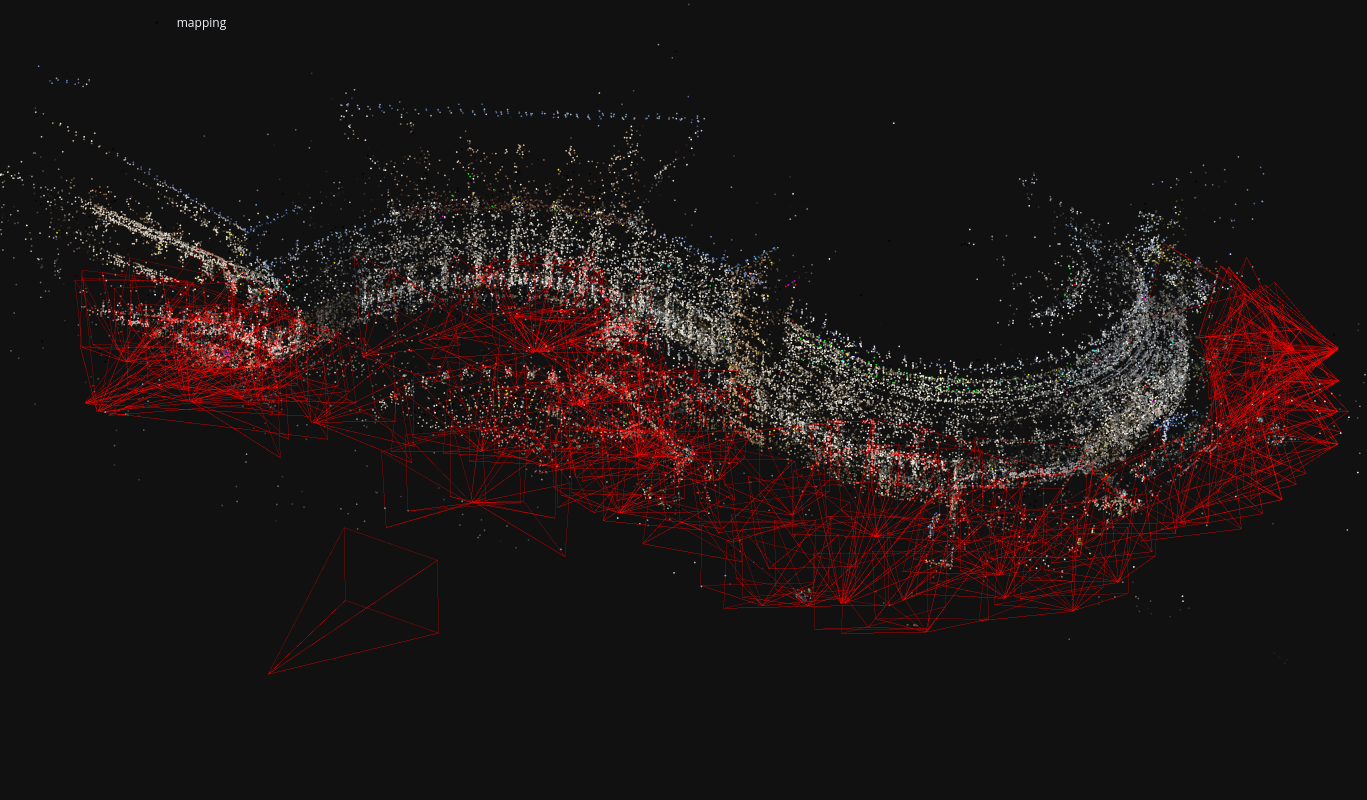 visualization of the camera poses
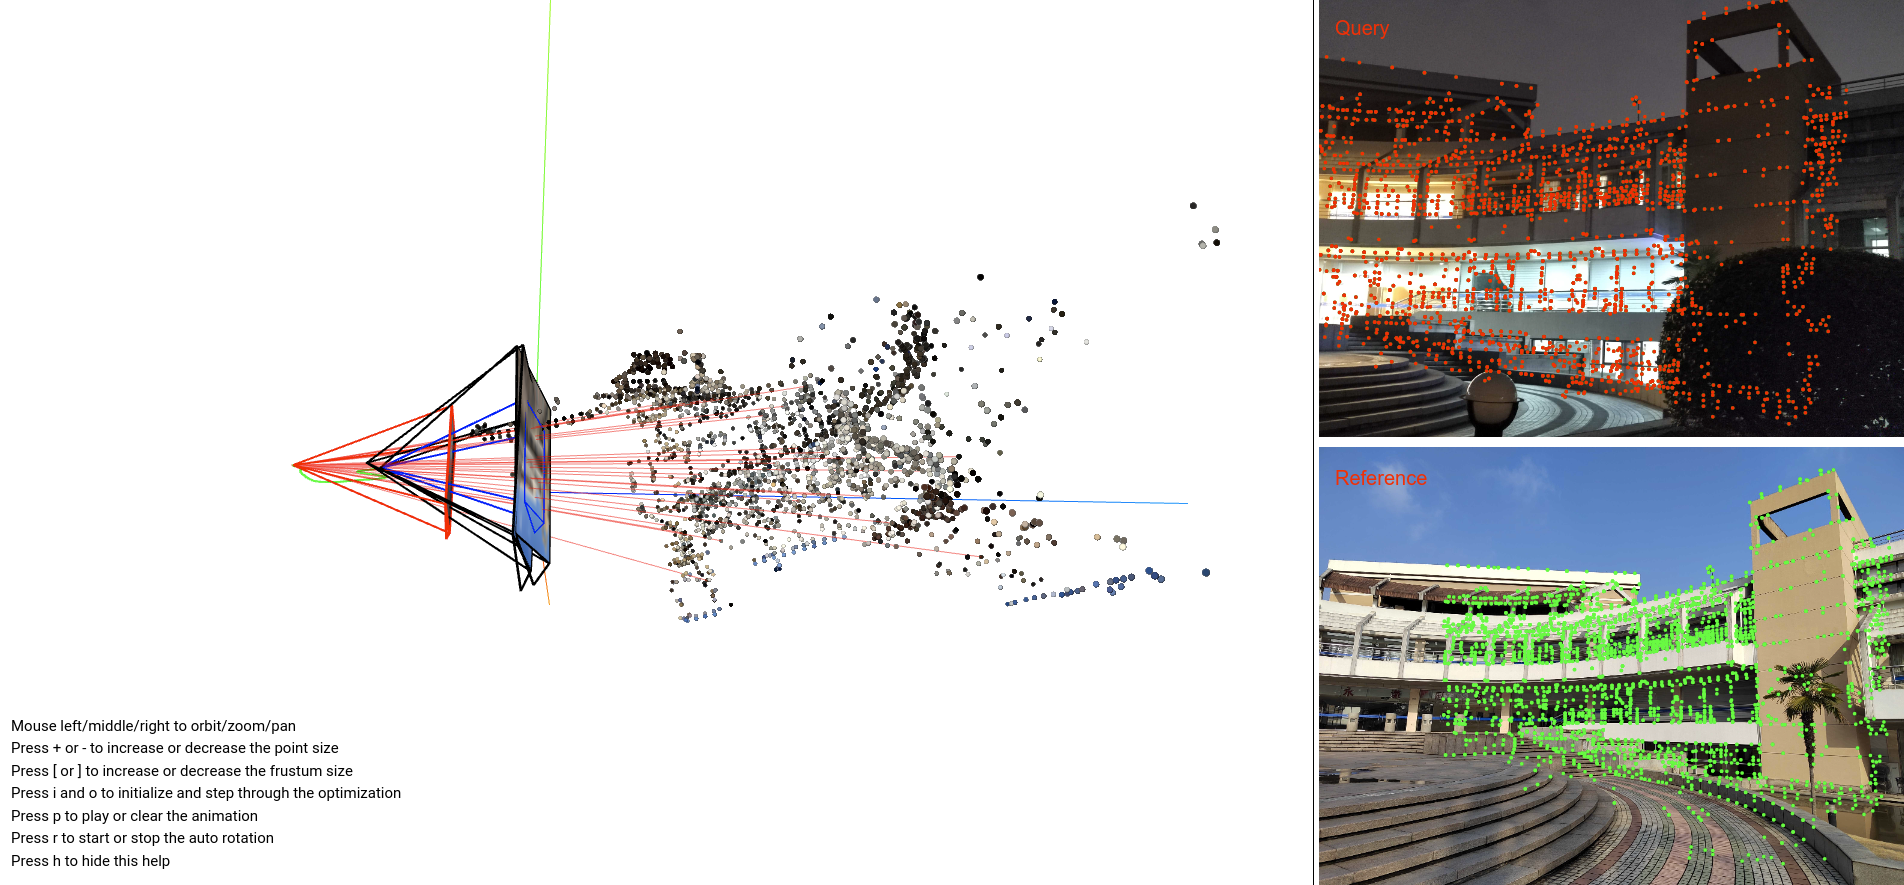
- The visual localization results of the pixloc are shown below. For each query image, we first find the closest image in the database (which has a known camera pose) and obtain the relative pose relation. At this point we also get the absolute camera pose of the query image. The animation exhibits the relative pose of the query image with respect to the reference image.
 |
 |
Mapping and transformation of the keypoints
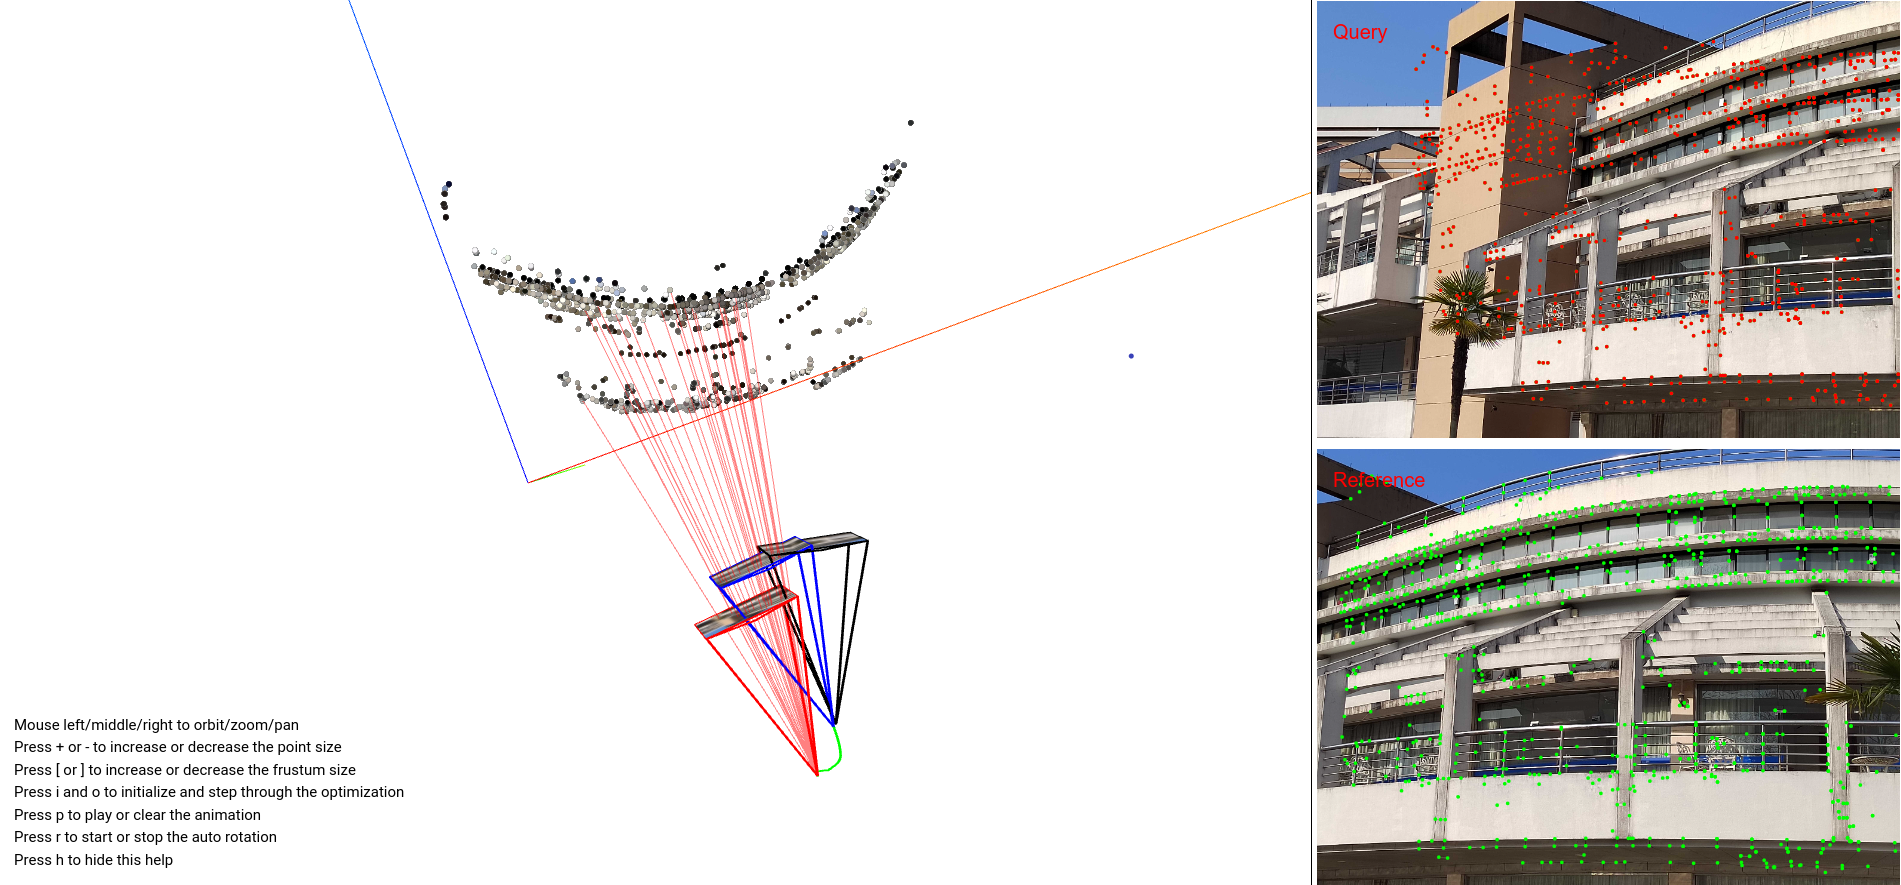
 visualization of the camera poses
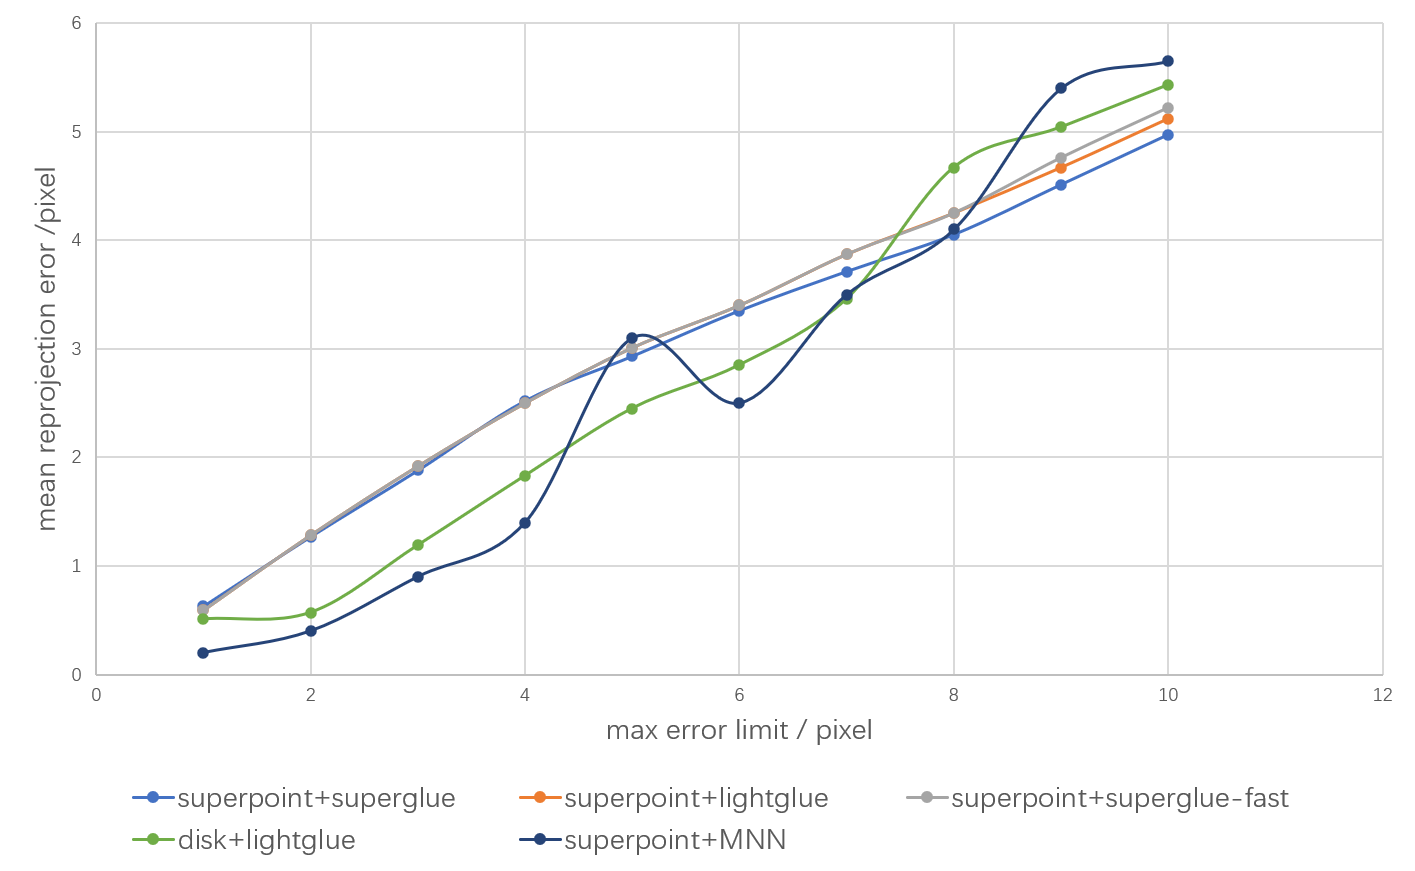
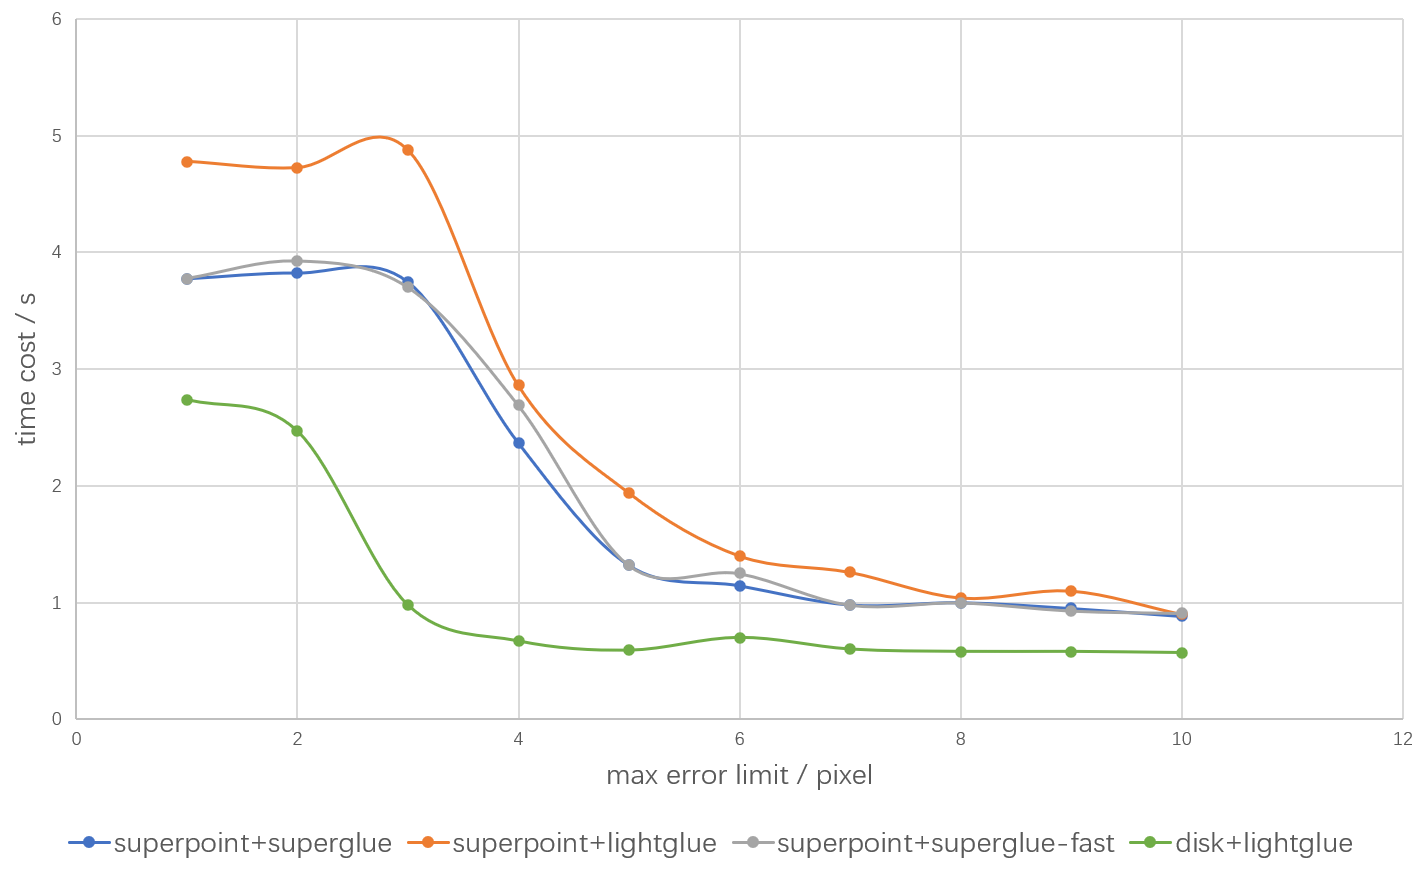
- The charts below show the mean reprojection error and the time to localize a query image on the basis of 3D models reconstructed using different algorithms (the independent variable is the tolerance for error).
 |
 |
- The confidence of the visual localization result is presented in the form of a heat map.